Abstract
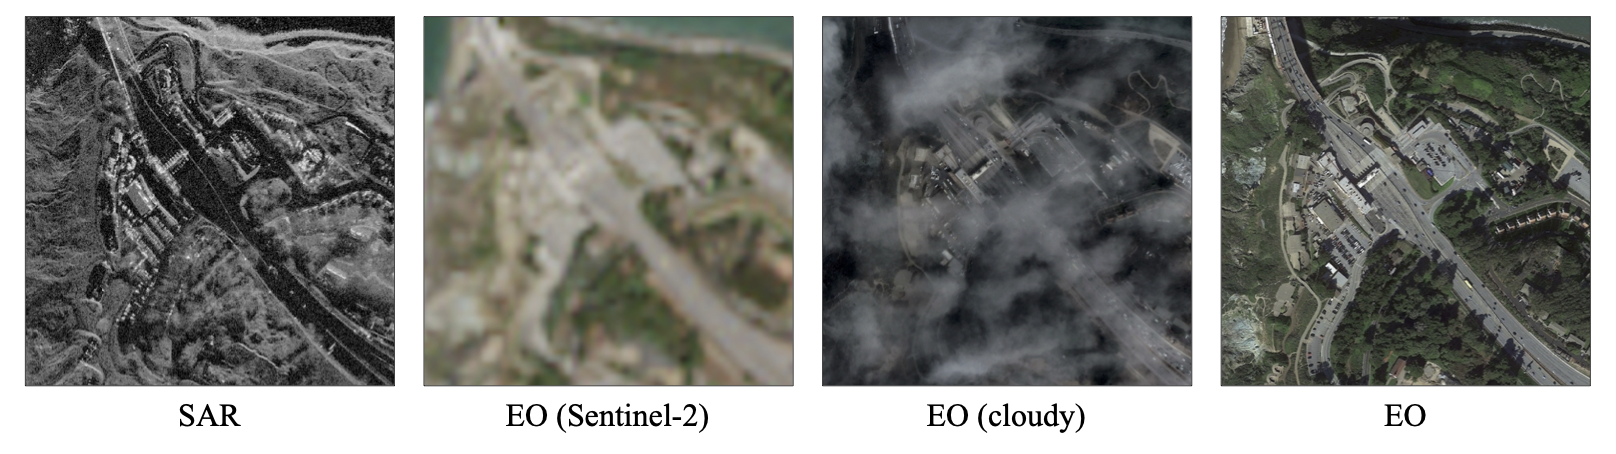
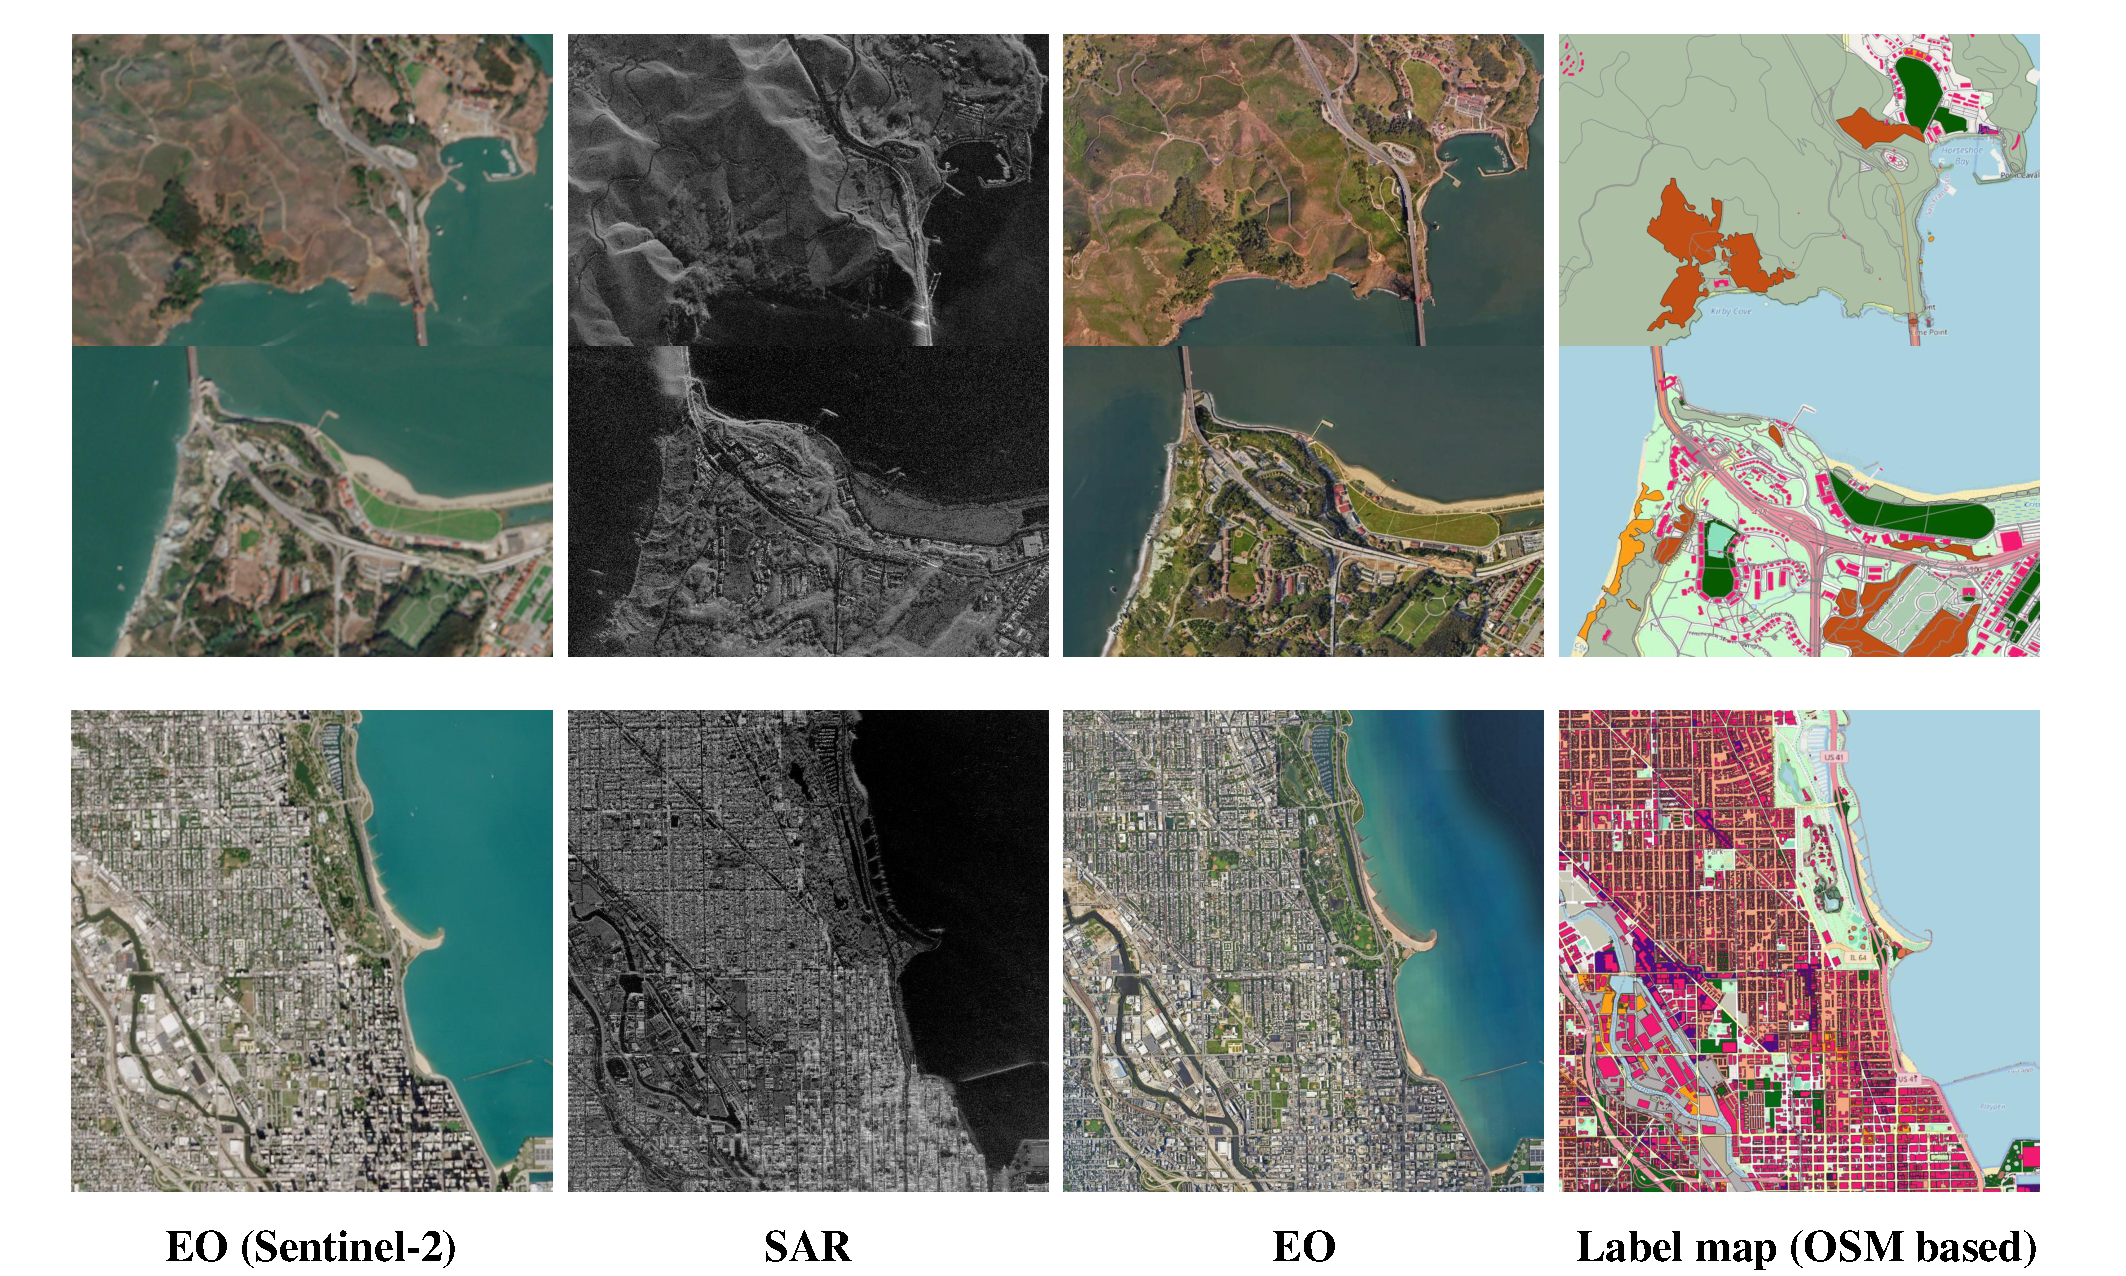
Electro-optical (EO) images are essential to a wide range of remote sensing applications. With the advent of data-driven models, the efficiency of EO image analysis has significantly improved, enabling faster and more effective outcomes in these applications. However, EO images have inherent limitations—they cannot penetrate cloud cover and are unable to capture imagery at night. To overcome these challenges, synthetic aperture radar (SAR) images are employed, as they can operate effectively regardless of weather conditions or time of day. Despite this advantage, SAR images come with their own difficulties: they are affected by speckle noise, complicating analysis, and existing algorithms developed for EO imagery are not directly transferable to SAR data. To address these issues, we introduce SAR2Earth, a benchmark dataset specifically designed for SAR-to-EO translation. By translating SAR images into EO-like representations, SAR2Earth allows the extensive range of algorithms developed for EO imagery to be applied effectively to SAR data. The dataset consists of 18 spatially aligned pairs of SAR and EO images, collected from 8 distinct regions encompassing both urban and rural. We provide comprehensive evaluations, detailed model analyses, and extensive experimental results.

Metadata Description
Each image pair in the SAR2Earth dataset is accompanied by metadata that provides essential geospatial and temporal information. This metadata allows users to analyze the spatial resolution and capture time differences between the SAR and EO images, enhancing the dataset's applicability for time-sensitive and location-specific research.
The metadata includes the following fields:
- img_id: Unique identifier for each image pair.
- lon: Longitude coordinate of the image center.
- lat: Latitude coordinate of the image center.
- gsd: Ground Sampling Distance (GSD) indicating the spatial resolution in meters.
- sar_year, sar_month, sar_day: Date of the SAR image capture.
- eo_year, eo_month, eo_day: Date of the EO image capture.
Metadata Example
| img_id | lon | lat | gsd (m) | SAR capture date | EO capture date |
|---|---|---|---|---|---|
| 00558 | 112.63297 | 0.07641 | 0.6 | 2021-04-20 | 2020-11-04 |
| 00559 | 112.63756 | 0.07641 | 0.6 | 2021-04-20 | 2020-11-04 |
| 00560 | 112.63985 | 0.07641 | 0.6 | 2021-04-20 | 2020-11-04 |